Learn more about important trading and financial terms here. Need more help? Our team is ready.
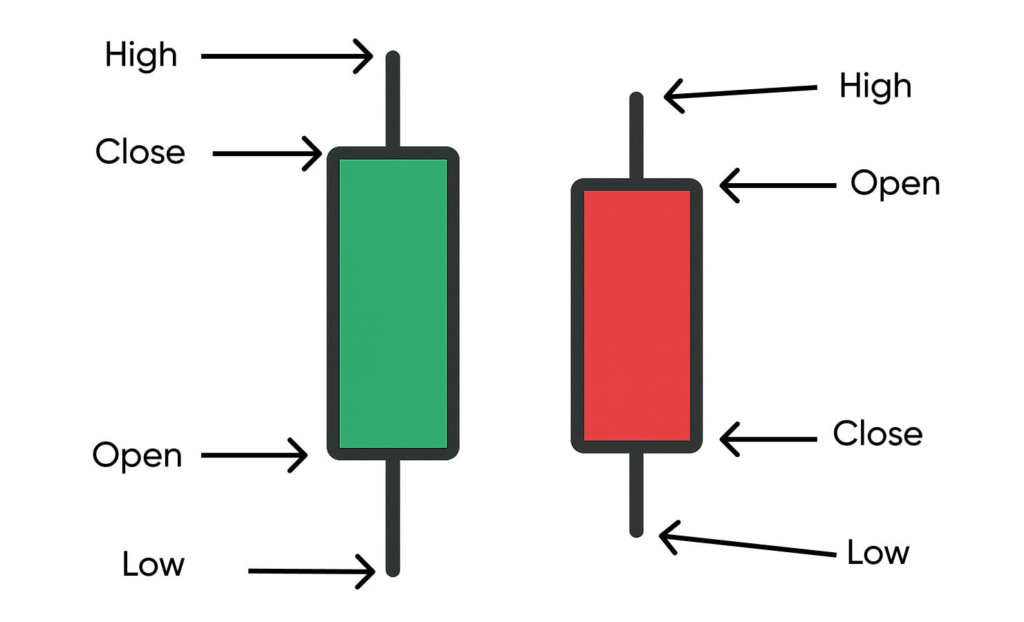
A candlestick chart displays an asset’s price movement over a specific period. Each candle shows four key prices:
Open: The price at which the candle’s time period begins.
High: The highest point of the upper wick.
Low: The lowest point of the lower wick.
Close: The price at which the candle’s time period ends.
The “body” of a candle represents the difference between the opening and closing prices, while the upper and lower wicks show the highest and lowest prices reached during that period.
Now, if we talk about the candlestick chart patterns, they are formations created by one or more candles that traders study to interpret price behaviour. Some common examples include Doji, Hammer, Engulfing, and Morning Star patterns.
How to Read Candlestick Charts?
Reading a candlestick chart starts with identifying the open, high, low, and close of each candle. The relationship between these prices can create different types of candle bodies. Each type shows a different pattern of price movement during the period.
Let’s understand in detail:
Candle Scenario
What It Shows
Bullish Candle
The closing price is higher than the opening price.It shows that the price moved up during the period.
Bearish Candle
The closing price is lower than the opening price.It shows that the price moved down during the period.
Long Bullish Body
The large body indicates a strong “upward price” move, with the close substantially above the open.
Long Bearish Body
The large body indicates a strong “downward price” move, with the close substantially below the open.
Long Upper Wick
Price moved to a higher level but retreated before the candle closed.It shows a potential rejection of the higher price.
Long Lower Wick
Price moved to a lower level but recovered before the close.It shows rejection of the lower price.
Note: These patterns describe what happened to the price during the candle. Their interpretation can change depending on the surrounding candles, trading volume, and broader market context.
Perform a Deep Market Analysis on Trade246
Go beyond basic price charts with Trade246’s advanced market analysis setup. Register today and gain unlimited access to TradingView charts, 100+ technical indicators, and professional drawing tools. Use them to examine trends, momentum, volatility, support, and resistance across multiple assets.
We are a multi-asset trading platform offering access to NSE equities, 5,000+ US stocks, 50+ cryptocurrencies, Forex, commodities, domestic and global indices, and NFOs from a single dashboard. Trade at lifetime 0* brokerage and avail of a high leverage of up to 500X margin.
Want to Start Trading?
Open a free Trade246 account and get access to NSE, F&O, Forex, Commodities, Crypto, US Stocks & Indices — all from a single platform.